Understanding how to use a linear programming chart can make solving complex problems much easier. A linear programming chart helps you visualize and solve problems where you need to optimize a certain outcome, like maximizing profits or minimizing costs. By using this chart, you can see how different factors interact with each other and find the best solution to meet your goals.
In this blog post, we’ll walk you through the basics of creating and using a linear programming chart. Whether you’re trying to balance budgets, manage resources, or plan schedules, knowing how to read and create these charts will be a valuable skill. Let’s dive into the world of linear programming charts and discover how they can help you!
What is a Linear Programming Chart?
A linear programming chart is a graphical tool used to visualize and solve optimization problems. These problems often involve making the best use of resources, such as time, money, or materials, while following certain restrictions or constraints. The chart helps you see how different variables affect each other and how you can achieve the best possible outcome.
In simple terms, imagine you have a limited amount of money and you need to decide how to spend it to get the most benefit. A linear programming chart will show you how different spending options interact and help you choose the best way to use your money.
Why Use a Linear Programming Chart?
Using a linear programming chart offers several benefits:
- Visualization: It helps you see how different factors interact and affect your overall goal. This visual representation makes it easier to understand complex problems.
- Optimization: The chart helps you find the best possible solution to your problem by comparing different options and choosing the one that meets your goals most effectively.
- Decision Making: With a clear view of your options, you can make more informed decisions about how to allocate resources and manage constraints.
How to Create a Basic Linear Programming Chart
Creating a linear programming chart involves several steps. Here’s a simple guide to get you started:
- Identify the Variables: Start by determining the variables that affect your problem. For example, if you’re managing a budget, your variables might be different types of expenses.
- Define the Constraints: List the limitations or restrictions you need to consider. These might include budget limits, resource availability, or other conditions that affect your decision.
- Set the Objective Function: Decide what you want to achieve. This could be maximizing profit, minimizing costs, or any other goal that you want to optimize.
- Draw the Chart: On a piece of graph paper or using a spreadsheet tool, plot the constraints and objective function. The intersection of these lines will help you visualize the feasible region where the optimal solution lies.
- Analyze the Chart: Look at the feasible region on your chart. This area represents all the possible solutions that meet your constraints. Identify the point within this region that provides the best value for your objective function.
Understanding the Parts of a Linear Programming Chart
A linear programming chart typically consists of:
- Decision Variables: These are the factors you can control or change, like the amount of money spent on different items.
- Constraints: These are the limits or restrictions that you need to follow, such as budget caps or resource limits.
- Objective Function: This is the goal you are trying to achieve, such as maximizing profit or minimizing costs.
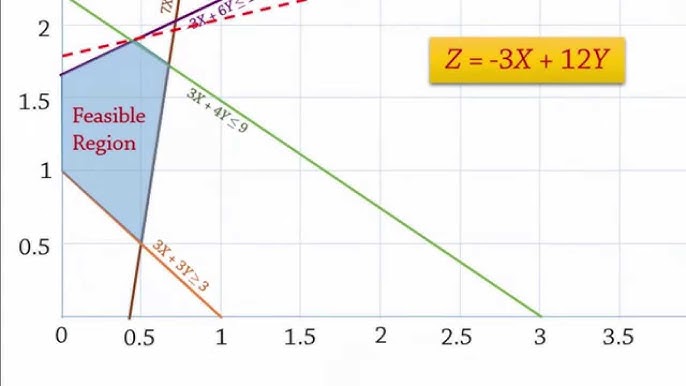
- Feasible Region: This is the area on the chart where all constraints are satisfied. It shows the possible solutions to your problem.
Step-by-Step Guide to Drawing Your Linear Programming Chart
- Plot the Constraints: Draw lines on your chart that represent each constraint. These lines will help you define the feasible region.
- Identify the Feasible Region: The area where all the lines overlap is your feasible region. This is where all your constraints are satisfied.
- Plot the Objective Function: Add a line that represents your objective function. Move this line to see which point in the feasible region provides the best value for your goal.
- Find the Optimal Solution: The point where the objective function line intersects the feasible region will give you the optimal solution. This is the best possible outcome given your constraints.
Common Mistakes in Linear Programming Charts and How to Avoid Them
- Ignoring Constraints: Make sure you include all constraints in your chart. Missing constraints can lead to incorrect solutions.
- Incorrect Plotting: Double-check your plots for accuracy. Errors in plotting can affect your results.
- Misinterpreting the Feasible Region: Ensure that you correctly identify the feasible region. This area is crucial for finding the optimal solution.
How to Read a Linear Programming Chart Easily
To read a linear programming chart:
- Look for the Feasible Region: This is the area where all constraints are satisfied.
- Find the Intersection Points: These are the points where the objective function line intersects the feasible region.
- Determine the Optimal Solution: The point that gives the highest or lowest value for your objective function is the optimal solution.
Using Linear Programming Charts to Solve Everyday Problems
Linear programming charts can be used in various everyday scenarios, such as budgeting for a project, planning a work schedule, or managing inventory. By applying the same principles, you can make better decisions and optimize your resources.
Tips for Making Your Linear Programming Chart More Effective
- Use Accurate Data: Ensure that all your
data and constraints are accurate to get reliable results.
- Update Regularly: As conditions change, update your chart to reflect new constraints or objectives.
- Practice Regularly: The more you use linear programming charts, the better you will understand how to create and interpret them.
Conclusion
It is a great tool to help you solve problems where you need to make the best use of what you have. By using this chart, you can see clearly how different choices affect your goals, like how much profit you can make or how to stay within a budget. It’s like having a map that shows you the best path to take.
With practice, you’ll get better at making these charts and using them to find the best solutions. Whether you’re working on a school project, managing a budget, or planning anything that needs organizing, a linear programming chart can be really helpful. Keep exploring and using this tool to make smart decisions and solve your problems!
FAQs
Q: What is it used for?
A: A linear programming chart is used to solve problems where you need to make the best use of limited resources while following certain rules. It helps you see the best way to achieve your goals.
Q: How do I start creating a linear programming chart?
A: Begin by identifying the variables, setting the constraints, and defining your goal. Then, plot these on a graph to find the feasible region and optimal solution.
Q: What does the feasible region in a linear programming chart represent?
A: The feasible region is the area on the chart where all constraints are satisfied. It shows all the possible solutions that meet your requirements.
Q: How can I find the best solution using a linear programming chart?
A: Look for where the objective function line intersects the feasible region. The point that gives the highest or lowest value for your goal is the best solution.
Q: Can a linear be used for everyday problems?
A: Yes, you can use linear to solve everyday problems like budgeting, scheduling, or planning. It helps you make better decisions with the resources you have.